The Grand Tack (movies and most graphics by Kevin Walsh)
As discussed on the terrestrial planet formation and water delivery page, Mars has long been a problem because simulations of terrestrial accretion systematically produce Mars analogs that are about an order of magnitude too massive (first pointed out by Wetherill 1991 and re-emphasized quantitatively by Raymond et al 2009). This problem comes about simply because in any simple model for the Sun's protoplanetary disk there is too much mass near Mars' orbit, and it is hard to prevent Mars from growing big.
The Grand Tack (Walsh et al 2011, Nature) is the solution to the Mars problem that Kevin Walsh, Alessanrdo Morbidelli, Dave O'Brien, Avi Mandell and I came up with. It relies on the fact that if the disk of terrestrial planet-formign embryos and planetesimals had an outer edge at 1 AU, then a small Mars (with a large Earth and Venus) is a natural outcome (Wetherill 1978, and shown especially clearly by Hansen 2009). But why should the disk of embryos have an edge at 1 AU? To understand this, we need to rewind the clock a bit and think about what was happening in the gaseous protoplanetary disk phase, when Jupiter and Saturn were starting to form.
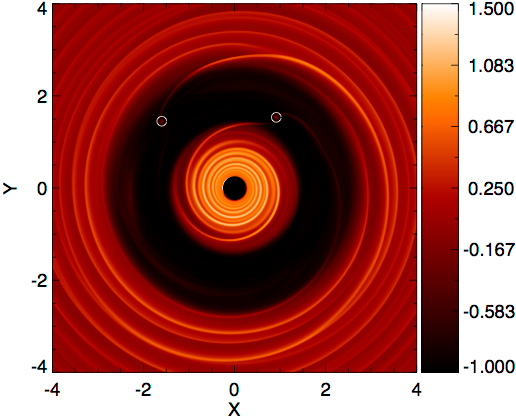
The sequence of events in the Grand Tack starts late in the protoplanetary disk phase as the cores of the giant planets were forming. First, Jupiter's core accreted sufficient gas from the disk to become a true gas giant and to carve a gap in the disk. It "type 2" migrated inward. Next, Saturn's core started to accrete gas and migrate inward. Saturn caught up to Jupiter and became lodged in Jupiter's outer 2:3 mean motion resonance (Pierens & Nelson 2008). At this point, the structure of the disk probably looked something like this (figure from Pierens & Raymond 2011):
With Jupiter and Saturn in such a tight configuration and with overlapping gaps in the disk, the direction of their migration was reversed and the two planets "tacked" and migrated back outward (this mechanism was first demonstrated by Masset & Snellgrove 2001). Jupiter and Saturn's outward migration slowed as the disk slowly dissipated and the giant planets were left much farther out, at roughly 5.4 and 7.2 AU, respectively. Although this two phase migration of the giant planets is somewhat complicated, it is a natural outcome of two growing giant planets interacting with a gaseous protoplanetary disk (Morbidelli & Crida 2007, Pierens & Raymond 2011).
Putting the pieces together, here is a simple diagram that illustrates the phases of the Grand Tack:
In this picture, the tack happened when Jupiter was at 1.5 AU. This value is not related to what we know about planet migration, but is ad hoc and was specifically chosen to truncate the disk of embryos at 1 AU. Naturally, we need to choose a specific evolution of the giant planets to reproduce our specific Solar System.
So, in the Grand Tack model Jupiter migrated across the asteroid belt not once but twice! How could the asteroid belt survive this? Answering that question comprised most of the work in Walsh et al 2011.
Below is a sequence of movies showing simulations in which Saturn follows path 'A' from the graphic above: Saturn reaches its final mass when Jupiter is at 1.5 AU, then the two tack and migrate back outward. I chose these movies for illustrative purposes even though they are not quite as pretty as some of the newer ones; please note that our conclusions have almost no dependence on whether Saturn follows curve A or B. In these movies all small bodies interior to Jupiter are colored in red and called "S-type", and all small bodies that started exterior to Jupiter is in blue and called "C-type".
This first movie shows Jupiter's inward migration phase. The top panel shows the orbital inclination vs. semimajor axis for all the particles in the simulation, and the bottom panel shows the orbital eccentricity vs. semimajor axis. As also seen in the simulations with a single migrating planet, Jupiter shepherds some material inward with its 3:2 and 2:1 interior mean motion resonances and scatters some outward.
At this point, Jupiter and Saturn are about to tack so let's zoom out. Now you can see there outer disk of "primordial" blue C-type material exterior to where Saturn's core formed. In this example the primordial disk starts at 6 AU, although in the main simulations from Walsh et al 2011 we also included Uranus and Neptune and a population of planetesimals between the giant planets.
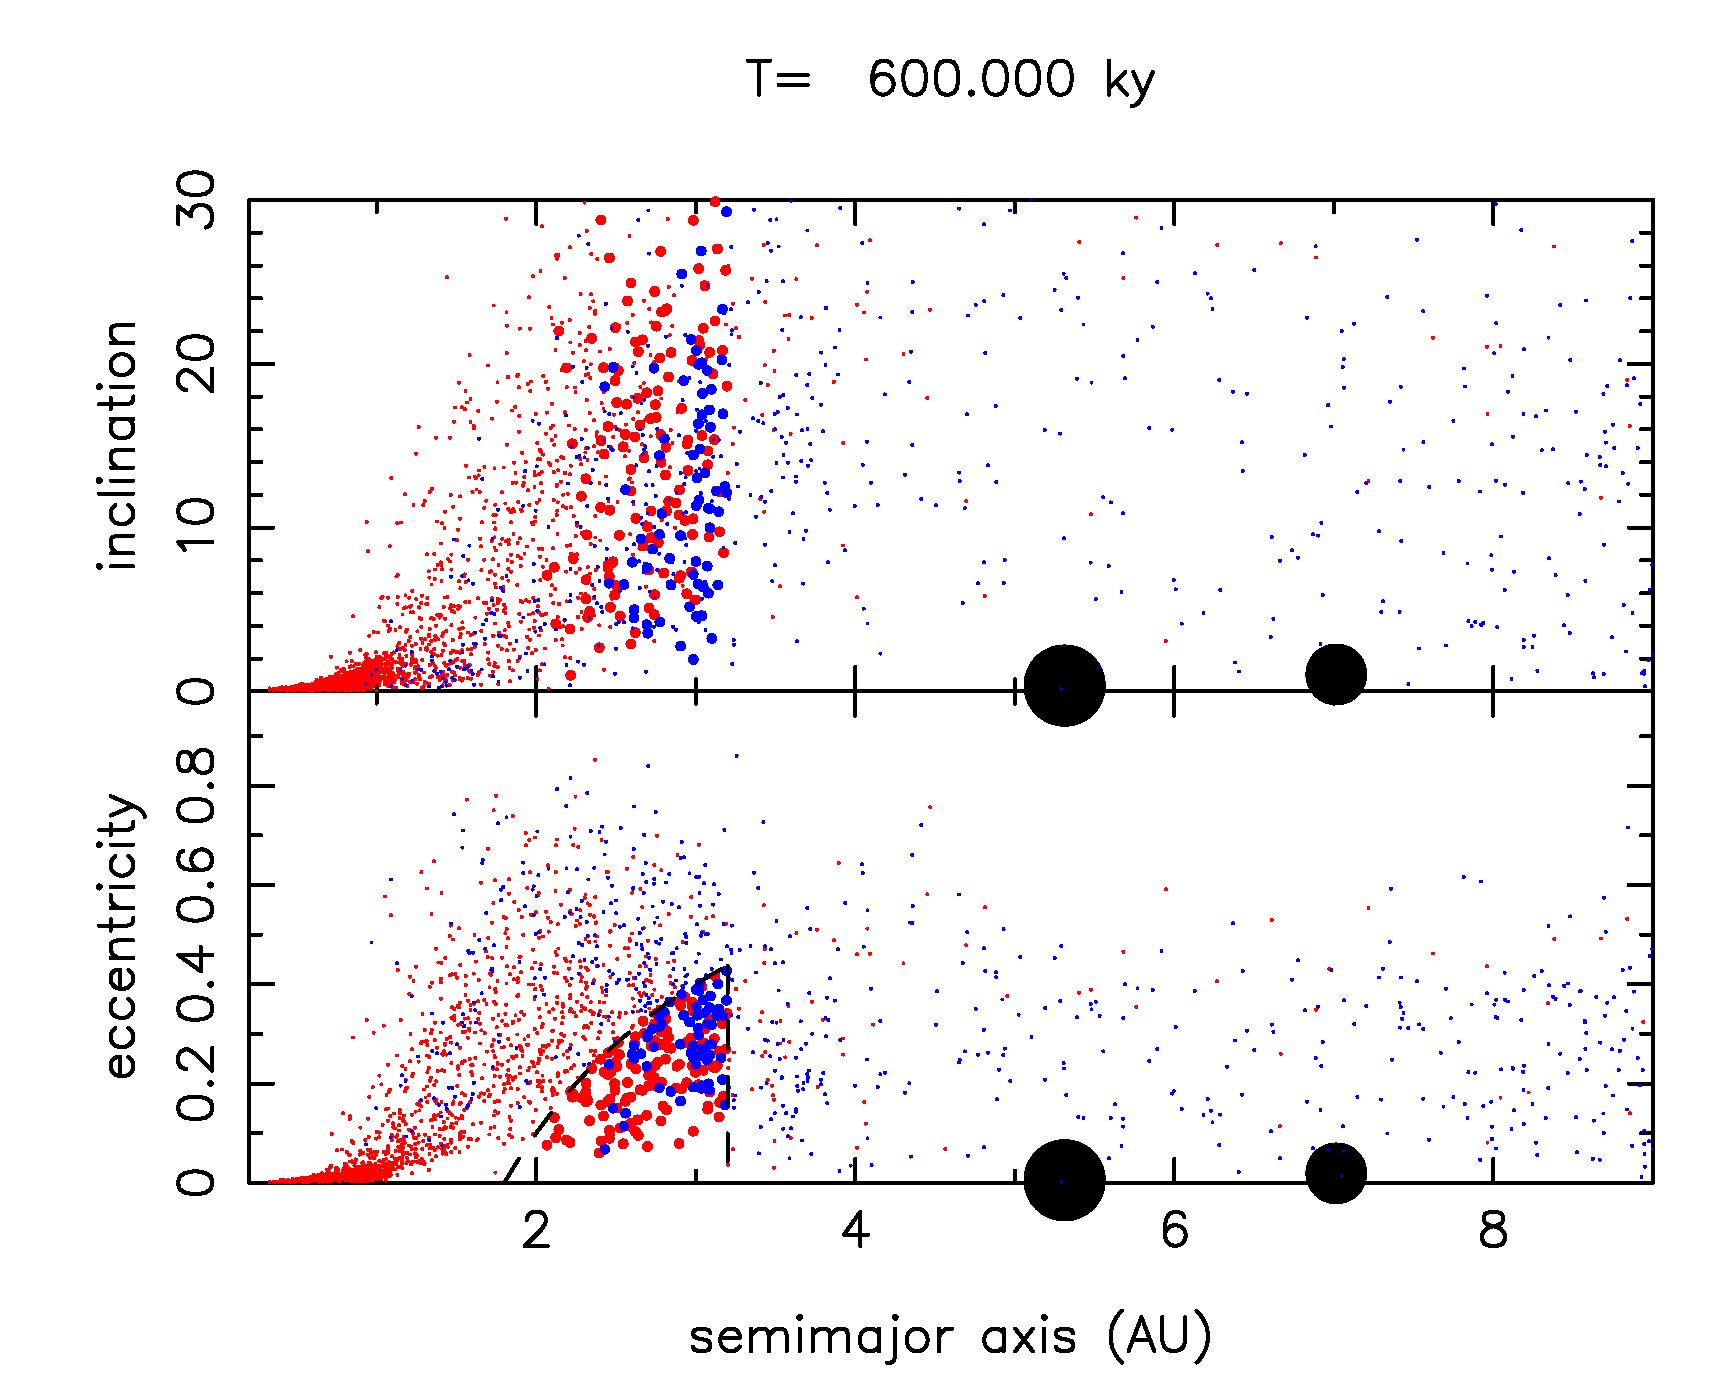
Next, the giant planets tack and migrate back out through the asteroid belt. First, they run into the red S-types that were scattered out during the inward migration, and then they run into the blue C-types. The vast majority of these small bodies were ejected completely from the Solar System but a small fraction (a little less than 1%) are implanted in the asteroid belt.
The next figure shows that asteroid belt adter the protoplanetary disk has dissipated and the giant planets' migration is done (objects in bold are those that were actually captured in the belt). The simulated asteroid belt reproduces the key characteristics of the actual asteroid belt: 1) The inner belt is dominated by S-types and the outer belt by C-types; and 2) the total mass and orbital distribution of asteroids are consistent with their later evolution (chaotic dynamics and the late heavy bombardment). Success!
But what about the terrestrial planets? As you can see in this movie, the inner disk of embryos and planetesimals was indeed truncated by Jupiter's migration.
Once Jupiter migrated back outward, the disk of embryos and planetesimals was left to evolve more or less in isolation. On timescales of 30-100 million years the terrestrial planets finished forming. In this particular simulation, four terrestrial planets formed, including a good Mars analog.
However, note that the "initial conditions" of the previous movies were not quite accurate. There is a tail of high-eccentricity C-type material with orbits that intersect the terrestrial planet-forming region. In fact, there is about 10 times more C-type material on such orbits than the C-types that end up getting implanted into the asteroid belt! And, this C-type stuff has the same chemical signature as C-type asteroids, which happen to have the same chemical signature as water on Earth. So, this tail of high-eccentricity C-type planetesimals represents the source of Earth's water. In the following movie (made by Dave O'Brien), the tail of C-type material is included. When a "wet" C-type planetesimal hits a planet the blue dot in the center of the planet grows in size. As you can see, water is indeed delivered to Earth!
Now, to our final distribution of simulated terrestrial planets. The plot shows planet mass vs orbital distance. Although we don't reproduce the exact masses and orbits of the terrestrial planets, we show that Mercury, Venus, Earth and Mars all fall in the distribution of our simulated planets.
So, the Grand Tack model is able to explain the structure of the inner Solar System including the masses and orbits of the terrestrial planets and the large-scale structure! It also has important implications for the accretion of the Earth and also the outer Solar System -- that work is in progress.
BACK TO MAIN PAGE