In this study, we have improved the census of stars and properties of the various subgroups known in the young stellar association located in the Lupus star-forming region based on Gaia-DR2 data. We searched over a field of 160 deg2 encompassing the main star-forming clouds of the Lupus complex. We identified 137 stars (spread over the molecular clouds Lupus 1 to 6) that are probable members of the Lupus association, out of which 47 are new members (an increase of more than 50% with respect to the number of previously known members). We also confirm that about 80% of the historically known members of the region with available astrometry in the Gaia-DR2 catalogue are more likely to be background sources unrelated to Lupus, field stars or members of the adjacent Sco-Cen association in light of our new membership analysis, suggesting that previous results should be revised and taken with caution.
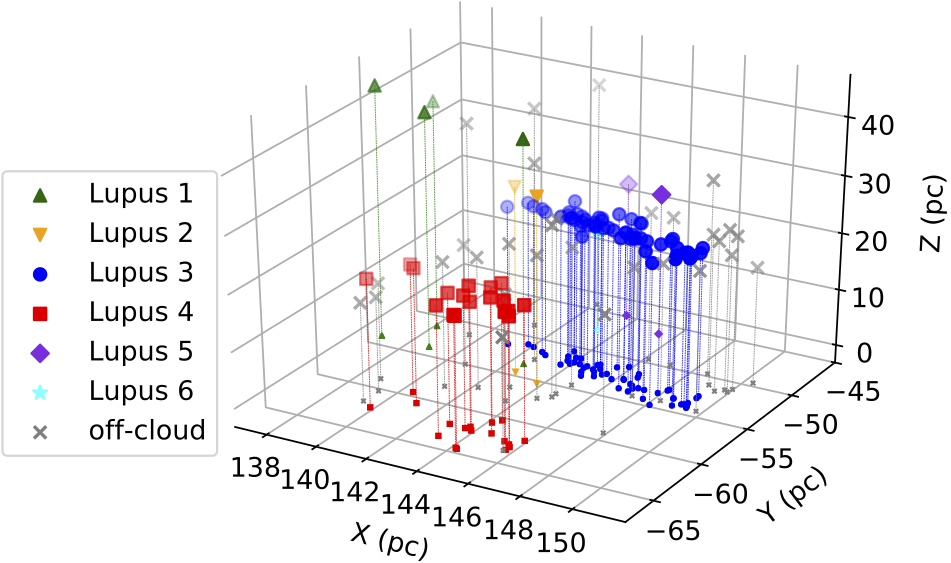
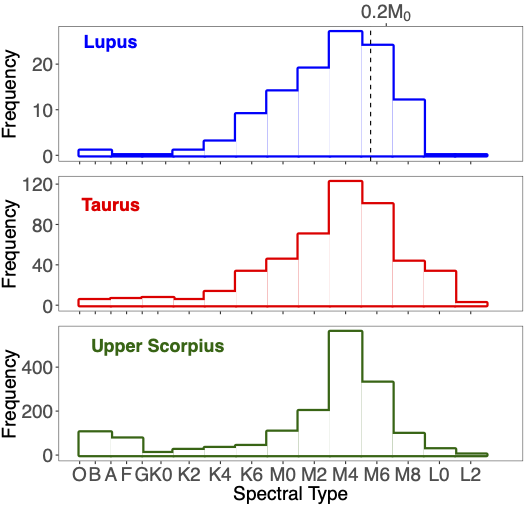
Our results on the 6D structure of the Lupus region (Figure 1) show that the different subgroups of the complex (defined by the sample of stars projected towards the various molecular clouds) are located at the same distance (of about 160 pc) and move with the same spatial velocity. This confirms that the Lupus subgroups are comoving and belong to the same association. The HR-diagram shows that most stars in our sample are younger than 5 Myr and they cover the mass range from about 0.03 to 2.4 M☉. Our results show that there is a superposition of ages between disc-bearing and discless stars in the Lupus association. The median age of the Lupus subgroups ranges from about 1 to 3 Myr and we therefore conclude that they are coeval. Both age indicators (fraction of disc-bearing stars and isochronal ages) reveal that the Lupus association is younger than the population of YSOs in the Corona-Australis star-forming region recently investigated by our team with the same methodology. Our new sample of Lupus stars is complete down to 0.2 M☉ and the IMF shows little variation compared to other star-forming regions, as illustrated un the Figure 2.